Casio CFX-9950GB PLUS Grafik-Handbuch - Seite 4

Blättern Sie online oder laden Sie pdf Grafik-Handbuch für Taschenrechner Casio CFX-9950GB PLUS herunter. Casio CFX-9950GB PLUS 12 Seiten. 6. matrix calculations
Auch für Casio CFX-9950GB PLUS: Software-Handbuch (20 seiten), Benutzerhandbuch (18 seiten), Handbuch Kommunikation (13 seiten), Programm-Handbuch (18 seiten), Dieses Handbuch zuerst lesen (13 seiten), Funktion Handbuch (14 seiten), Grafik-Handbuch (8 seiten), Grafik-Handbuch (6 seiten), Grafik-Handbuch (12 seiten), Grafik-Handbuch (12 seiten), Grafik-Handbuch (12 seiten), Grafik-Handbuch (10 seiten), Berechnungen Handbuch (13 seiten), Berechnungen Handbuch (18 seiten), Berechnungen Handbuch (15 seiten), Handbuch Komplexe Zahlen (6 seiten), Berechnungen Handbuch (6 seiten), Berechnungen Handbuch (20 seiten)
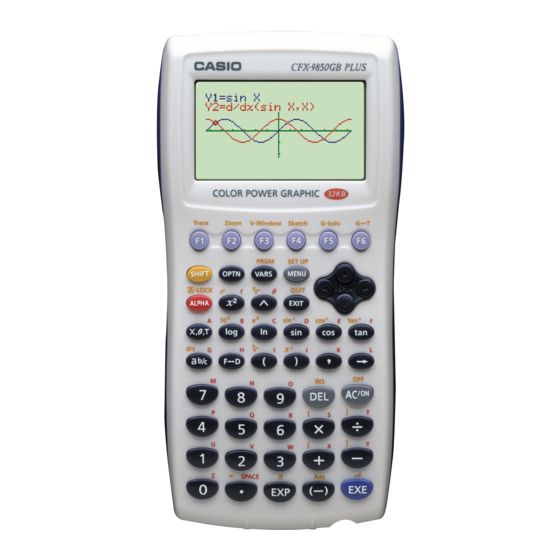
Casio CFX-9950GB PLUS Grafik-Handbuch

13-3 Drawing a Dynamic Graph

The following is the general procedure you should use to draw a Dynamic Graph.
1. Select or input a function.
2. Define the dynamic coefficient.
3. Assign values to each of the coefficients of the function.
4. Specify the range of the dynamic coefficient.
5. Specify the speed of the draw operation.
6. Draw the Dynamic Graph.
u u u u u To set Dynamic Graph conditions
1. Input the function you want to graph. Here we will edit a built-in function to
184
• This is a coefficient whose value changes in order to produce the different
graphs.
• If the dynamic coefficient is already defined from a previous operation, you can
skip this step.
• If the range of the dynamic coefficient is already defined from a previous
operation, you can skip this step.
• If the speed is already defined from a previous operation, you can skip this
step.
Example
To use Dynamic Graph to graph
A changes from 2 to 5 in increments of 1
Use the following View Window parameters.
Xmin
Xmax =
Xscale =
input our function.
5(B·IN)
c1(SEL)
= – 6.3
Ymin
6.3
Ymax =
1
Yscale =
y
x
2
= A (
–1)
–1 as the value of
= – 3.1
3.1
1
1
2 3 4 5 6