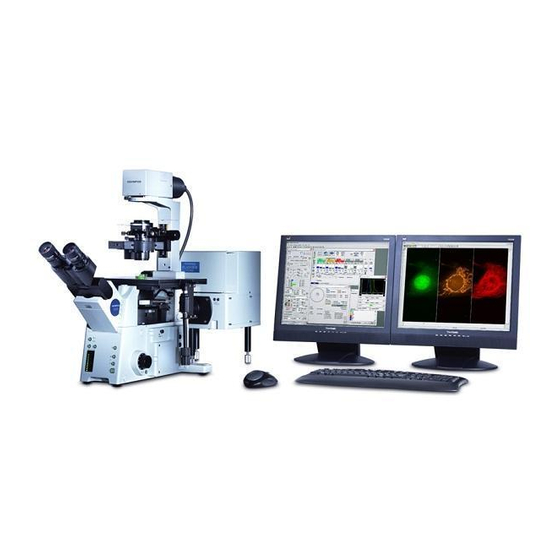
Olympus Fluoview FV1000 Benutzerhandbuch - Seite 5
Blättern Sie online oder laden Sie pdf Benutzerhandbuch für Mikroskop Olympus Fluoview FV1000 herunter. Olympus Fluoview FV1000 9 Seiten. Confocal microscope
Auch für Olympus Fluoview FV1000: Übersicht (28 seiten), Benutzerhandbuch (42 seiten), Kurzanleitung (7 seiten), Kurzanleitung (7 seiten), Manuallines (3 seiten)

Olympus FV1000 User guide
August 3, 2011
You can optimize the image quality with Hi‐Lo LUT (Look‐Up Table). Click LUT
button to bring the LUT
control window and select Channel and click Hi‐Lo button (Ctrl‐H
shortcut key will do the same without opening LUT window). Now
the image is displayed using this specific look‐up table where red
pixels represent intensity beyond scale (saturated) and blue pixels
represent 0 pixel value. To maximize the signal‐to‐noise ratio of the
image, adjust the acquisition setting (laser power level, HV, Offset)
such that the image shows a few red and blue pixels while you are
scanning.
Often excitation/emission profiles of fluorophores you are using may
be close, so there could be possible bleed‐through of a fluorophore
emission to neighboring channel. To minimize this, the detecting
range of each channel can be adjusted by changing Spectral Setting.
Click on
, it will bring Spectral Setting window. Change the range
of spectrum for each channel (CHS1 and CHS2) by sliding, widening,
or narrowing the tabs
or arrowheads.
h
Use Area panel
to rotate and zoom the imaging area (click on 0 and 1 buttons to return to the original
viewing area). To rotate the viewing area, click on the red dot and drag clock‐ or counter‐clockwise. With
zoomed view, you can select the scanning area by moving the blue‐lined box around. To zoom a specific region
in, click
icon and draw a box on the live view area. It will zoom in the area specifically.
Once you are satisfied with the setting, stop scanning. Set the scan speed to slow rates (~10‐12.5us/pixel)
(the slower the speed set, the better the signal‐to‐noise ratio, but the more bleaching). Click XY button
to acquire an image. When acquisition is done, a 2D view window will appear.
E. Z‐Series Image Acquisition
Use this mode to obtain optical section through the depth (z
dimension) of your sample that can be used for 3D visualization.
Click
button to scan. Use the arrowheads
buttons
or the fine focus knob on the remote controller to focus into
b
different Z‐axial planes (large arrowhead buttons shift a full step
size and small ones a half step size). When you find upper limit of
your sample, click End Set button. Bring the objective down until
you find lower limit and click Start Set button. Determine the
Step Size and the number of Slices, which correlate with each
other. It is recommended to set the step size similar to the
d
optical section thickness of the objective you are using, so that
there is no gap between the optical sections upon projection into
b
c
3D. The step size can be fixed by checking the box
.
