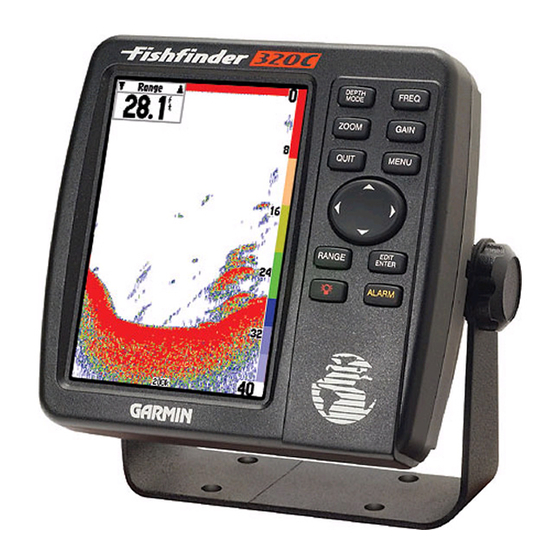
Garmin Fishfinder 320C Manuel du propriétaire et manuel de référence - Page 24
Parcourez en ligne ou téléchargez le pdf Manuel du propriétaire et manuel de référence pour {nom_de_la_catégorie} Garmin Fishfinder 320C. Garmin Fishfinder 320C 38 pages. Sunlight-readable color sonar
Également pour Garmin Fishfinder 320C : Modèle de manuel (1 pages), Spécifications (2 pages), Spécifications (2 pages)

Unit Operation
Main Menu Options
Main Menu - Tools Tab
16
Main Menu - Temp Tab
• Custom Range — allows you to specify a custom viewing range/scale. Once enabled, this range will
appear as 'Custom' in the 'Range' adjustment control. The left value will be the top of the scale and the
right value, the bottom of the scale.
• Background Color — allows you to change the background color of the sonar display. Choices are
Black, Blue or White.
• Number Size — allows you to choose between a Normal or Large sized Basic depth/temp/speed
display. This does not change the Advanced data fi eld number sizes.
• Temperature and Water Speed — hides or displays temperature and water speed on the Sonar
Page. When set to 'Auto', the unit will automatically display this information, only if it is received
from the transducer.
Tools Tab
Controls the display of useful sonar tools. The following settings are available:
• Flasher — with the 'Flasher' active, a graphic Flasher representation will be displayed on the far right
side of the graph. This graphic Flasher displays structure and bottom returns much the same as a true
Flasher. You may fi nd this feature particularly useful when using 'Fish Symbols'.
• Color Bar — shows a gradient scale of the current Target Level setting (see page 11).
• Temperature Graph — toggles On or Off the display of a temperature graph on the Sonar Page.
Temp (Temperature) Tab
Displays the water temperature log (if equipped with a temperature transducer/sensor). The graph reads
from right to left, so that the most recent temperature measured is displayed on the far right side of the graph.
The dotted lines within the graph indicate intervals in the temperature scale and the duration of time. The
following settings are available:
• Log and Graph Scale — sets the temperature range (in degrees) for displaying the log. Select 'Auto'
to have the unit automatically determine the best range, or select a span of 2, 4, 6, 8 or 10 degrees.
• Reset (Scale) — resets the scale range for the temperature graph. This is useful when the scale spans
a large range due to extreme temperature changes. Only shows when Log and Graph Scale is set to
'Auto'.
• Log Duration — sets how fast or slow the temperature log scrolls; the shorter the time duration, the
faster the temperature log scroll. Select a duration from 1 minute to 2.5 hours.
