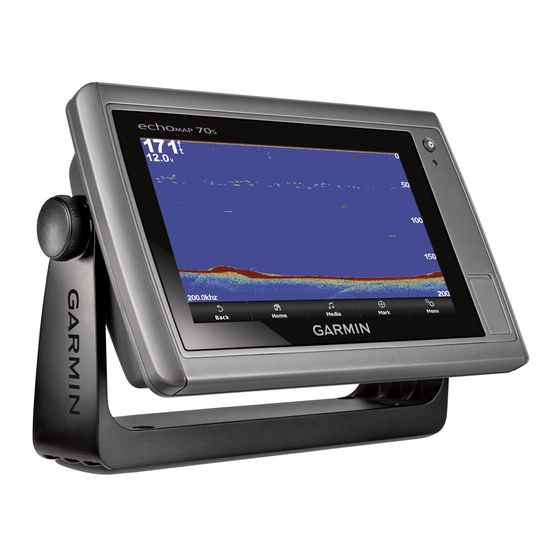
along the right side of the screen shows the depth of detected
objects as the screen scrolls from the right to the left.
Depth information
Suspended targets or fish
Bottom of the body of water
DownVü Sonar View
NOTE: Not all models support DownVü sonar technology and
transducers.
NOTE: To receive DownVü scanning sonar, you need a
compatible chartplotter or fishfinder and a compatible
transducer.
DownVü high-frequency sonar provides a clearer picture below
the boat, providing a more detailed representation of structures
the boat is passing over.
Traditional transducers emit a conical beam. The DownVü
scanning sonar technology emits a narrow beam, similar to the
shape of the beam in a copying machine. This beam provides a
clearer, picture-like image of what is beneath the boat.
SideVü Sonar View
NOTE: Not all models support SideVü sonar and scanning
transducers.
NOTE: To receive SideVü scanning sonar, you need a
compatible chartplotter, a compatible sounder module, and a
compatible transducer.
SideVü scanning sonar technology shows you a picture of what
lies to the sides of the boat. You can use this as a search tool to
find structures and fish.
Left side of the boat
Right side of the boat
The transducer on your vessel
Trees
Old tires
Logs
Distance from the side of the boat
SideVü/DownVü Scanning Technology
Instead of a more common conical beam, the SideVü/DownVü
transducer uses a flat beam to scan the water and ground to the
sides of your boat.
14
Split-Zoom Sonar View
The split-zoom sonar view shows a full-view graph of sonar
readings, and a magnified portion of that graph, on the same
screen.
Select Sonar > Split Zoom.
Split-Frequency Sonar View
In the split-frequency sonar view, one side of the screen shows
a full-view graph of high frequency sonar data, and the other
side of the screen shows a full-view graph of lower frequency
sonar data.
NOTE: The split-frequency sonar view requires the use of a
dual-frequency transducer.
Select Sonar > Split Frequency.
Pausing the Sonar Display
From a Sonar view, select MENU > Pause Sonar.
Creating a Waypoint on the Sonar Screen
1
From a sonar view, select MENU > Pause Sonar.
2
Select the location of the waypoint.
3
Select New Waypoint.
Viewing Sonar History
You can scroll the sonar display to view historical sonar data.
1
From a sonar view, select MENU > Pause Sonar.
2
Drag the screen or use the arrow keys.
Adjusting the Level of Detail
You can control the level of detail and noise shown on the sonar
screen either by adjusting the gain for traditional transducers, or
by adjusting the brightness for DownVü and SideVü/DownVü
transducers.
If you want to see the highest intensity signal returns on the
screen, you can lower the gain or brightness to remove lower
intensity returns and noise. If you want to see all return
information, you can increase the gain or brightness to see
more information on the screen. This also increases noise, and
can make it more difficult to recognize actual returns.
1
From a sonar view, select MENU.
2
Select Gain or Brightness.
3
Select an option:
• To increase or decrease the gain or brightness manually,
select Up or Down.
• To allow the chartplotter to adjust the gain or brightness
automatically, select an automatic option.
Adjusting the Color Intensity
You can adjust the intensity of colors and highlight areas of
interest on the sonar screen by adjusting the color gain for
Sonar

