- ページ 6

電卓 Casio CFX-9850GC PLUSのPDF 機能マニュアルをオンラインで閲覧またはダウンロードできます。Casio CFX-9850GC PLUS 14 ページ。 6. matrix calculations
Casio CFX-9850GC PLUS にも: 製品カタログ (16 ページ), 仕様 (1 ページ), 通信マニュアル (13 ページ), プログラム・マニュアル (18 ページ), 最初に読むマニュアル (13 ページ), グラフマニュアル (8 ページ), グラフマニュアル (6 ページ), グラフマニュアル (12 ページ), グラフマニュアル (12 ページ), グラフマニュアル (12 ページ), グラフマニュアル (12 ページ), グラフマニュアル (10 ページ), 計算マニュアル (13 ページ), 計算マニュアル (18 ページ), 計算マニュアル (15 ページ), 複素数マニュアル (6 ページ), 計算マニュアル (6 ページ), 計算マニュアル (20 ページ)
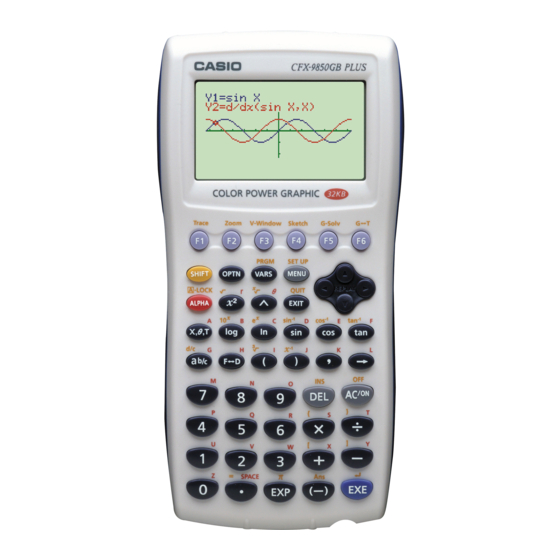
Casio CFX-9850GC PLUS 機能マニュアル
10 - 2
Graphing with the Sketch Function
k k k k k Plotting Points
When plotting points on a graph, first display the sketch menu and then press 6
(g) 1 (PLOT) to display the plot menu.
u u u u u To plot points in the STAT, GRAPH, TABLE, RECUR and CONICS
1. After drawing the graph, display the sketch menu and press 6 (g) 1 (PLOT)
2. Use the cursor keys to move the pointer the locations of the points you want to
u u u u u To plot points in the RUN or PRGM Mode
The following is the syntax for plotting points in these modes.
158
• {Plot} ... {plot a point}
• {Pl·On} ... {plot point at specific coordinates}
• {Pl·Off} ... {delete point at specific coordinates}
• {Pl·Chg} ... {switch status of point at specific coordinates}
Modes
Example
To plot a point on the graph of
1 (Plot) to display the pointer in the center of the screen.
plot and press w to plot.
• You can plot as many points as you want.
x
• The current
- and
X and Y.
x
Plot <
-coordinate>, <
Example
To plot a point at (2, 2)
Use the following View Window parameters.
Xmin
Xmax = 5
Xscale = 1
y
-coordinate values are assigned respectively to variables
y
-coordinate>
= –5
Ymin
Ymax = 10
Yscale =
[Sketch]-[PLOT]
[Sketch]-[PLOT]-[Plot]
y
x
x
x
=
(
+ 2)(
– 2)
[Sketch]-[PLOT]-[Plot]
= –10
2