- ページ 3

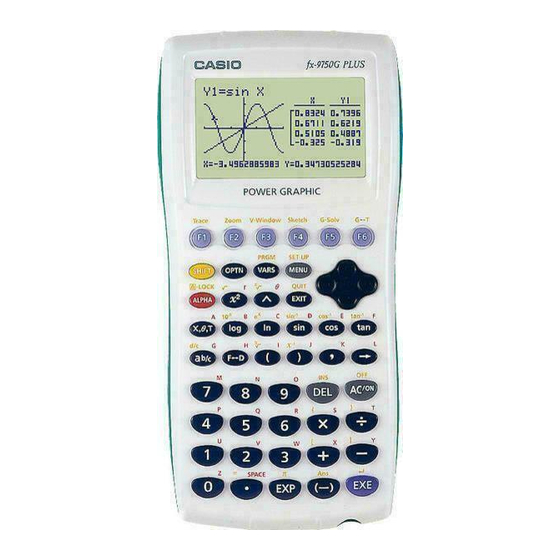
電卓 Casio fx-9750G PLUSのPDF グラフマニュアルをオンラインで閲覧またはダウンロードできます。Casio fx-9750G PLUS 6 ページ。 Graphing calculator
Casio fx-9750G PLUS にも: 製品カタログ (16 ページ), 通信マニュアル (13 ページ), プログラム・マニュアル (18 ページ), 最初に読むマニュアル (13 ページ), 機能マニュアル (14 ページ), グラフマニュアル (8 ページ), グラフマニュアル (12 ページ), グラフマニュアル (12 ページ), グラフマニュアル (12 ページ), グラフマニュアル (12 ページ), グラフマニュアル (10 ページ), 計算マニュアル (13 ページ), 計算マニュアル (18 ページ), 計算マニュアル (15 ページ), 複素数マニュアル (6 ページ), 計算マニュアル (6 ページ), 計算マニュアル (20 ページ), ユーザーマニュアル (13 ページ)

Casio fx-9750G PLUS グラフマニュアル
12-2 Using Graph-to-Table
u u u u u To store graph pointer coordinates in a table
P.5
1. Input the two functions.
2. Press 6 (DRAW) (or w) to draw the
3. Press 1 (Trace) and then use d to move the pointer to the first intersection.
4. Press w to store the coordinates of
5. Use e to move the pointer to the point
• If the Derivative item in the set up screen is set to "On", the derivative at the
location of the trace pointer is also stored in the table.
Example
To store the points of intersection and the coordinates for the
following graphs where X = 0:
x
Y1 =
2
Use the following View Window parameters.
Xmin
Xmax = 5
Xscale = 1
graph in the left half of the screen.
the pointer location in the table on the
right side of the screen.
where X = 0 and then press w.
Next, move the pointer to the next
intersection and press w again.
– 3
Y2 = –
= –5
Ymin
Ymax = 10
Yscale =
x
y
/
-coordinate value
x
+ 2
= –10
2
177