- ページ 8

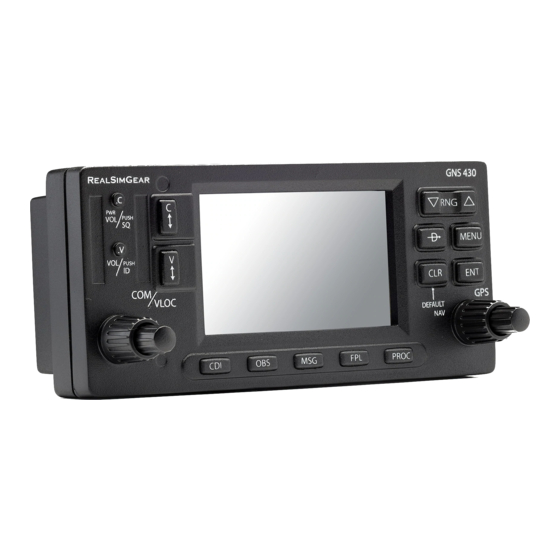
アビオニクス・ディスプレイ Garmin GNS 430のPDF パイロット・マニュアル補遺をオンラインで閲覧またはダウンロードできます。Garmin GNS 430 27 ページ。 Friendlypanels gps for microsoft fs9 & fsx
Garmin GNS 430 にも: パイロット・マニュアル (22 ページ), 取扱説明書 (6 ページ), パイロット・マニュアル補遺 (4 ページ), クイック・リファレンス (23 ページ), パイロット・マニュアル補遺 (22 ページ), 仕様 (2 ページ), パイロット・オペレーション・ハンドブック (10 ページ), クイック・リファレンス (17 ページ), 取扱説明書 (27 ページ)

Garmin GNS 430 パイロット・マニュアル補遺
Section 2
Goodrich STORMSCOPE Interface
Cell mode uses a clustering program to identify
clusters of electrical activity that indicate cells. Cell
mode is most useful during periods of heavy storm
activity. Displaying cell data during these periods frees
the user from sifting through a screen full of discharge
points and helps to better determine where the storm
cells are located.
6

Displaying Storm Data on the Map Page

The Map Page displays cell or strike information using yellow lightning strike symbology overlaid on
a moving map. This added capability improves situational awareness, which in turn makes it much easier
for the pilot to relate storm activity to airports, navaids, obstacles and other ground references.
Storm Activity
Storm Data Displayed on the Map Page
Storm data is displayed on the Map Page only if aircraft heading is available.
In normal operation, the current mode and rate are displayed in the top right corner of the Map Page.
The mode is described by the word "STRIKE" when in strike mode, or "CELL" when in cell mode.
The strike data display phases are:
1. Lightning Symbol (latest strikes; less than one minute; a black guard band is placed around the strike symbol
during the fi rst six seconds of display)
2. Large Plus "+" sign (more than one minute old)
3. Small Plus "+" sign (more than two minutes old)
4. Strike Data is no longer displayed (after three minutes)
Cell Mode
Strike Rate