- ページ 9
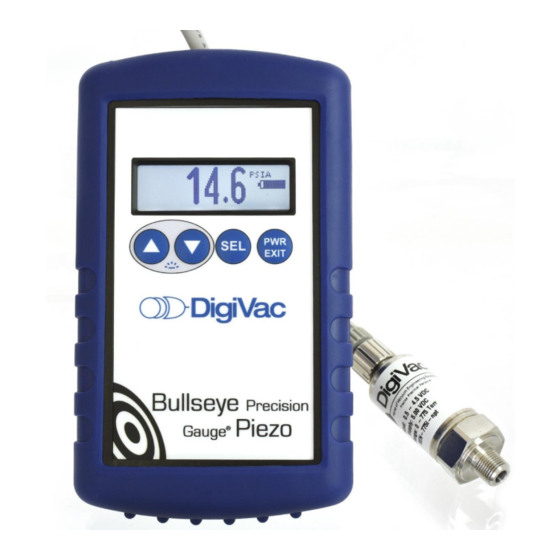
計測機器 DigiVac Bullseye PiezoのPDF ユーザーマニュアルをオンラインで閲覧またはダウンロードできます。DigiVac Bullseye Piezo 18 ページ。

atmosphere.
Display Line graph
The auto-scaling (or, auto-ranging) time graph is a microscope into the pump down data.
Maximum &
Minimum value
is measured
range
In this mode, the pump down graph is shown with a linear pressure scale that is fit to the pressure
range of the data set.
The height of the graph display is the pressure range of the data set in a linear scale (not log). The top
left figure is the maximum value in this range, and the bottom left figure is the minimum value in this
range. The top right figure is the current or most recent value in the instrument.
Please
Note: Sometimes this visualization is not useful, showing noise. This noise comes from the
instrument's process of measurement, as well as the vacuum system under measurement. In this
sense, the auto scaling graph is a data visualization microscope.
Useful Quick Tip:
This visualization can show a very small climbing or descending trend that the
vacuum analysis algorithm has not declared as a leak or pumping.
High Resolution
The High-Resolution format has three digits of precision. For example, an internal vacuum value of
1234 millitorr (μm Hg) would be displayed as 1.23 Torr in the Precision numeric format with Torr units.
Additionally, this format gives the raw vacuum measurement data which may be useful for trending
but may result in a noisier reading.
Scientific
The scientific format has two digits of precision with a base ten exponent following conventional
usage. For example, an internal vacuum value of 52 Torr (mm Hg) would be displayed as 5.2 x E
1 0 2 0 C a m p u s D r i v e W e s t , M o r g a n v i l l e , N J 0 7 7 5 1
s a l e s @ d i g i v a c . c o m w w w . d i g i v a c . c o m
7 3 2 - 7 6 5 - 0 9 0 0
Copyright 2020, DigiVac, Inc., All rights reserved.
9
Current or most
recent pressure
+1
.
