- ページ 11
スクラバー Arometrix Extraction FinderのPDF ユーザーマニュアルをオンラインで閲覧またはダウンロードできます。Arometrix Extraction Finder 14 ページ。
Arometrix Extraction Finder にも: クイック・スタート・マニュアル (2 ページ), ユーザーマニュアル (20 ページ)

11
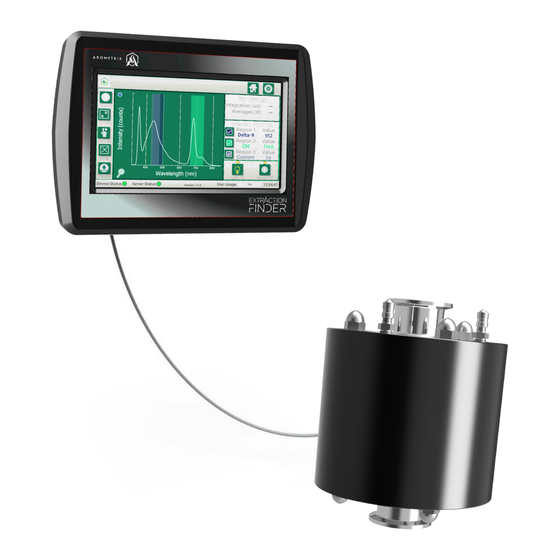
These correspond with the Region 1, Region 2, and Region 3 that are shown on the plots. When you press
one of these, you will see a Wavelength range. These will come preset with manufacturer's defaults;
however, you can edit the From and To how you see fit. See below.
Click "Default" to return back to manufacturer default. Next to the "Default" button, you will see a
molecule dropdown. When you press the Molecule Indicator dropdown, you will see different molecule
tracking options. You can select any of them, or set your own "Custom" molecule and region. See below.
Set Integration Time
This is meant to enable "AID (Auto)" by clicking the checkbox in the bottom-left corner of the screen. Auto
integration ensures that the signal from the spectrometer is maximized.
Set Scans to Average
This sets how many optical readings the sensor takes before plotting and displaying a result. More
readings that are averaged imply less noise, but less information. Arometrix recommends that you select 5.
Clock Settings
This should be set during initial acquisition. Set the Date Settings and the Time Settings. Then, Submit.
System Data
This will display "Bytes Available", "Bytes Used", and "Bytes Total". It will also show you % memory used,
and give you an option to "Clear Data".
Arometrix, Inc.
arometrix.com/resources
