Casio CFX-9850GC PLUS 그래프 매뉴얼 - 페이지 2

{카테고리_이름} Casio CFX-9850GC PLUS에 대한 그래프 매뉴얼을 온라인으로 검색하거나 PDF를 다운로드하세요. Casio CFX-9850GC PLUS 8 페이지. 6. matrix calculations
Casio CFX-9850GC PLUS에 대해서도 마찬가지입니다: 제품 카탈로그 (16 페이지), 사양 (1 페이지), 커뮤니케이션 매뉴얼 (13 페이지), 프로그램 매뉴얼 (18 페이지), 첫 번째 매뉴얼 읽기 (13 페이지), 기능 설명서 (14 페이지), 그래프 매뉴얼 (6 페이지), 그래프 매뉴얼 (12 페이지), 그래프 매뉴얼 (12 페이지), 그래프 매뉴얼 (12 페이지), 그래프 매뉴얼 (12 페이지), 그래프 매뉴얼 (10 페이지), 계산 매뉴얼 (13 페이지), 계산 매뉴얼 (18 페이지), 계산 매뉴얼 (15 페이지), 복소수 매뉴얼 (6 페이지), 계산 매뉴얼 (6 페이지), 계산 매뉴얼 (20 페이지)
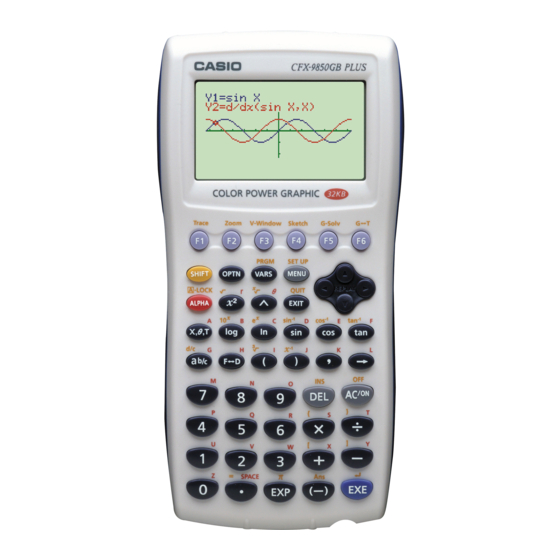
Casio CFX-9850GC PLUS 그래프 매뉴얼
11-1

Before Using Dual Graph

1. From the Main Menu, enter the GRAPH Mode. Next, display the set up screen
P.7
2. Press J.
P.112
k k k k k About Dual Graph Screen Types
The screen on the left side of the display is called the active screen , and the graph
on the left side of the display is called the active graph . Conversely, the right side
is the inactive screen , which contains the inactive graph . Any function that you
execute while using Dual Graph is always applied to the active graph. To execute
a function on the right-side inactive graph, you must first make it active by moving
it into the active screen.
Active Screen
Inactive Screen
168
and specify "Graph" for Dual Screen.
• For further details about the function key menu at the bottom of the display, see
"8-1 Before Trying to Draw a Graph".
• 8,192 bytes of memory are used whenever you set the Dual Screen setting to
"Graph".
Actual graph drawing is done here.
Use the inactive screen to make copies of active screen graphs, and for the result of
Zoom operations.
• Indicators appear to the right of the formulas in the function memory list to tell
where graphs are drawn with Dual Graph.
Performing a draw operation with the function marked "
screen causes the graph to be drawn on the right (inactive) side on the display.
The function marked "
Pressing 1 (SEL) while one of the function's is highlighted would causes its
"
" or "
" indicator to be cleared. A function without an indicator is drawn as
R
B
the active graph (on the left side of the display).
Indicates inactive graph (on right side of
display)
Indicates graph drawn on both sides of display
" is drawn on both sides of the graph.
B
" in the above example
R