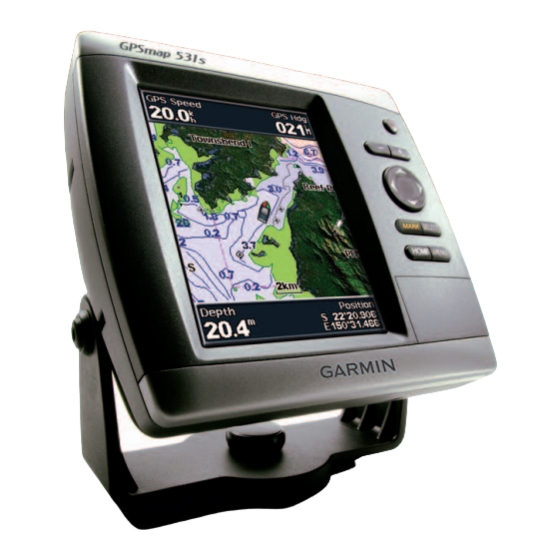
Garmin GPSMAP 536 사용자 설명서 - 페이지 9
{카테고리_이름} Garmin GPSMAP 536에 대한 사용자 설명서을 온라인으로 검색하거나 PDF를 다운로드하세요. Garmin GPSMAP 536 28 페이지. Gpsmap 400/500 series weather and xm satellite radio supplement
Garmin GPSMAP 536에 대해서도 마찬가지입니다: 설치 지침 매뉴얼 (12 페이지), 참조 매뉴얼 (2 페이지)

Forecast Information
The Forecast chart shows city forecasts, marine forecasts, warnings,
hurricane warnings, METARS, county warnings, weather fronts and pressure
centers (XM data only), surface pressure, and WX buoys.
Viewing Present Forecast Information
From the Home screen, select Information > Weather > Forecast.
Viewing Forecast Information for Another Time Period
Note: This feature is available only if you are receiving XM WX Satellite
Weather data. It is not available if you are receiving only cellular weather
data.
1. From the Home screen, select Information > Weather > Forecast.
2. Complete an action:
• To view the weather forecast for the next 12 hours, select right on the
Rocker, and to view forecasts up to 48 hours, in 12-hour increments,
select right on the Rocker again.
• To view the weather forecast for the previous 12 hours, select left on
the Rocker, and to view previous forecasts, up to 48 hours ago, in 12-
hour increments, select left on the Rocker again.
Viewing a Marine Forecast or an Offshore Forecast
1. From the Home screen, select Information > Weather > Forecast.
2. Select MeNU > Start Panning.
3. Pan the chart to an offshore location.
The Marine Forecast or offshore Forecast options appear when
forecast information is available.
4. Select Marine Forecast or offshore Forecast.
GPSMAP 400/500 Series Weather Supplement
Weather Fronts and Pressure Centers:
Note: This feature is available only if you are receiving XM WX Satellite
Weather data. It is not available if you are receiving only cellular weather
data.
Weather fronts appear as lines that indicate the leading edge of an air mass.
Front Symbol
Description
Cold front
Warm front
Stationary front
Occluded front
Trough
Pressure-center symbols often appear near weather fronts.
Pressure-
Description
Center
Symbol
Indicates a low-pressure center, which is a region of relatively
lower pressure. Moving away from a low-pressure center results
in increased pressure. Winds flow counterclockwise around low-
pressure centers in the northern hemispheres.
Indicates a high-pressure center, which is a region of relatively
higher pressure. Moving away from a high-pressure center
results in decreased pressure. Winds flow clockwise around
high-pressure centers in the northern hemispheres.
XM WX Satellite Weather and Cellular Weather
5
