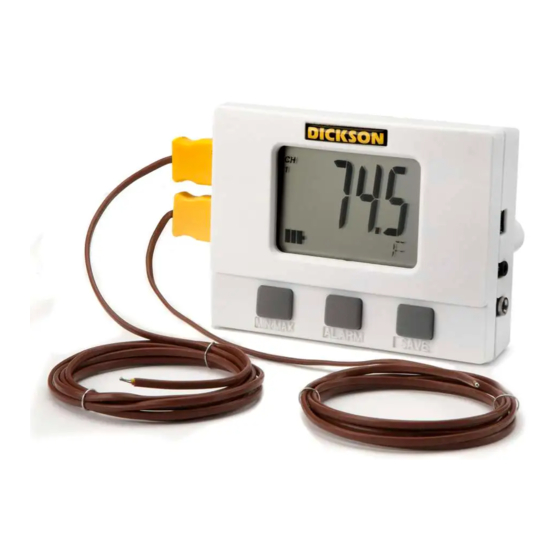
Dickson VFC325 웹 매뉴얼 - 페이지 5
{카테고리_이름} Dickson VFC325에 대한 웹 매뉴얼을 온라인으로 검색하거나 PDF를 다운로드하세요. Dickson VFC325 11 페이지. Vaccine display loggers operation

CAUTION: The preset alarm temperatures that you are setting are lower than the ambient or air
temperature. Therefore, when the alarm are enabled they will sound. Do the following:
Silencing the Alarm – press the ALARM button on the front of the unit to silence.
Disabling the Visual Alarm – press the ALARM button until CLR will appear on the display. ALRN
will continue to display until the logger & probe(s) have been positioned in the refrigerator and or
freezer.
12.
To setup Alarm Features, Click on the Alarms Tab
a. Check Alarm Enabled to display ALRN across the display if temperatures go out of the desired
ranges.
b. Check Buzzer Enabled for an audible alarm if temperatures go out of the desired ranges.
c. Click on Update to save these changes. To disable these alarms, click on the checkmark and choose
update.
d. Alarm Delay: allows delay of alarm notification in minutes up to 60 minutes. Enter the number of
minutes and click on update.
Note: These alarm features apply to both channels.
The logger is now sampling and ready for use. A Delta (∆) symbol will appear on the display to confirm
logging. You will have ambient temperatures until you position the probes inside the refrigerator or freezer.
Account for this movement when evaluating the data.
Mount the logger and position the probes. Allow time for the probes to display readings. Press the ALARM
button down until CLR appears on the display. The alarms are now reset.
Downloading Data on DicksonWare
Real Time Monitoring: Monitor and graph your process as it happens and print and save from real time
screen. (This feature should be used sparingly as it causes the battery to drain very quickly unless using
optional AC adapter)
Customize Graphed Data: DicksonWare™ calculates Min, Max and Average of all data collected.
Customize data by eliminating unnecessary data points and customize Min, Max and Average to show only
desired information.
Export Data: A snapshot of your graph or a real-time graph of points can be easily exported to other
programs such as Excel™ or PowerPoint™.
Super Size Storage: With the use of the optional Flash Memory Card and reader you can store 100
Full Data Loggers. This eliminates the need to physically remove your loggers from their application for
uninterrupted monitoring.
** CLICK ON THE FEATURES BUTTON IN THE **
SOFTWARE FOR DETAILED INSTRUCTIONS ON HOW TO USE ABOVE FEATURES
Download: Clicking this button will automatically extract all logged data into a Graph and Table format for
viewing. You may also choose to retrieve data via the optional Flash Memory Card. After Saving data to the
card, simply insert the card into your reader, open the LOG Folder, then double click on the appropriate LOD
file which will automatically open DicksonWare™, if not, manually open DicksonWare™. From the top Menu
bar, click on File > Open and browse to the appropriate drive for your reader and select the LOD file.
DicksonWare™ Software Specifications
•
Microsoft Windows® compatible
•
Allows for simple viewing and zooming of logged data
•
Easy set-up of Dickson Data Loggers including:
•
User selectable sample intervals from 10 seconds to 24 hours
•
Display temperature in °C or °F
•
Delayed logger start times
•
Logger data capacity can be set to wrap data or stop when full
•
Allow for real time monitoring and graphing.
•
Effortless exporting of data and graphs to other software
•
Data can be viewed in tabular (numeric/table) or graphical formats
•
Fast downloading of logged data - 30 seconds (typical) from full logger
•
Even shows battery power status for battery operated loggers
Rev. 10/07
