Casio CFX-9850G PLUS Graph Manual - Page 4

Browse online or download pdf Graph Manual for Calculator Casio CFX-9850G PLUS. Casio CFX-9850G PLUS 12 pages. 6. matrix calculations
Also for Casio CFX-9850G PLUS: User Manual (18 pages), Communications Manual (13 pages), Program Manual (18 pages), Read This First Manual (13 pages), Function Manual (14 pages), Graph Manual (8 pages), Graph Manual (6 pages), Graph Manual (12 pages), Graph Manual (12 pages), Graph Manual (12 pages), Graph Manual (10 pages), Calculations Manual (13 pages), Calculations Manual (18 pages), Calculations Manual (15 pages), Complex Numbers Manual (6 pages), Calculations Manual (6 pages), Calculations Manual (20 pages)
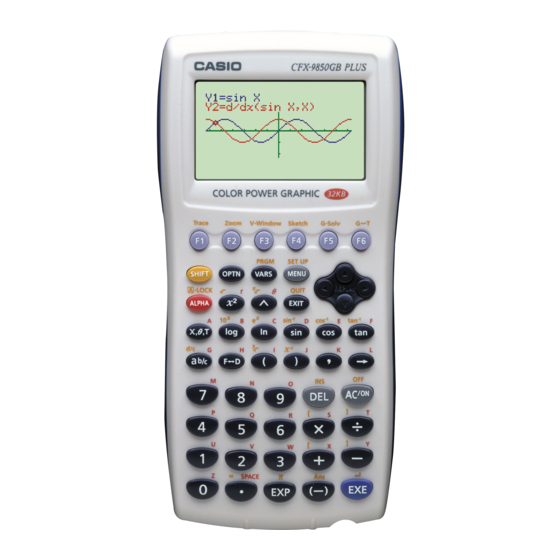
Casio CFX-9850G PLUS Graph Manual
14 - 2
Graphing a Conic Section
Example 2
1. Select the function whose graph you want to draw.
2. Press w and the variable input screen appears.
3. Assign values to each variable.
4. Press 6 (DRAW) to draw the graph.
k k k k k Conic Section Graphing Precautions
196
To graph the hyperbola –––––––––– – –––––––––– = 1
Use the following View Window parameters.
Xmin
= –8
Xmax = 12
Xscale = 1
ccccccc
cwcwdwbw
• Assigning the following types of values to variables contained in built-in
function produces an error.
(1) Parabola graph
A = 0
(2) Circle graph
R = 0 for (X – H)
2
A = 0 for AX
(3) Ellipse/hyperbola graph
A = 0 or B = 0
(X – 3)
2
Ymin
Ymax = 10
Yscale =
2
2
2
+ (Y – K)
= R
2
+ AY
+ BX + CY + D = 0
2
2
(Y – 1)
2
2
2
= –10
1