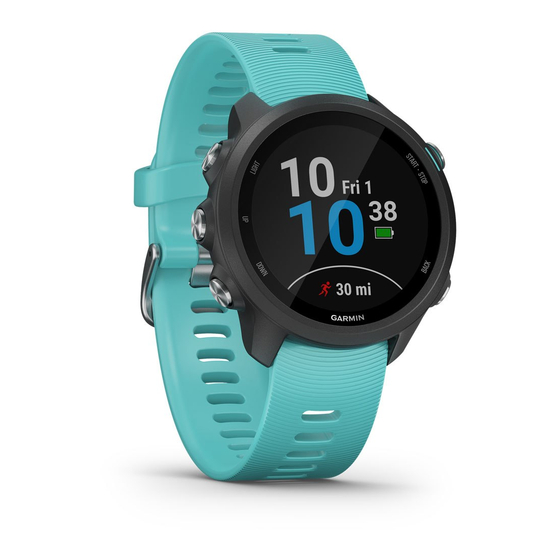
Garmin FORERUNNER 245 Manual do Proprietário - Página 20
Procurar online ou descarregar pdf Manual do Proprietário para Ver Garmin FORERUNNER 245. Garmin FORERUNNER 245 40 páginas.

Getting Pulse Oximeter Readings
You can manually begin a pulse oximeter reading on your
device at any time. The accuracy of the reading can vary based
on your blood flow, the device placement on your wrist, and your
stillness.
1
Wear the device above your wrist bone.
The device should be snug but comfortable.
2
Select UP or DOWN to view the pulse oximeter widget.
3
Select START.
4
Hold the arm wearing the device at heart level while the
device reads your blood oxygen saturation.
5
Keep still.
The device displays your oxygen saturation as a percentage.
NOTE: You can customize the pulse oximeter settings in your
Garmin Connect account.
Turning On Pulse Oximeter Sleep Tracking
You can set your device to continuously measure your blood
oxygen saturation while you sleep.
NOTE: Unusual sleep positions can cause abnormally low
sleep-time SpO2 readings.
1
From the pulse oximeter widget, hold UP.
2
Select Sleep Pulse Ox > On.
Tips for Erratic Pulse Oximeter Data
If the pulse oximeter data is erratic or does not appear, you can
try these tips.
• Remain motionless while the device reads your blood oxygen
saturation.
• Wear the device above your wrist bone. The device should
be snug but comfortable.
• Hold the arm wearing the device at heart level while the
device reads your blood oxygen saturation.
• Use a silicone band.
• Clean and dry your arm before putting on the device.
• Avoid wearing sunscreen, lotion, and insect repellent under
the device.
• Avoid scratching the optical sensor on the back of the device.
• Rinse the device with fresh water after each workout.
Heart Rate Variability and Stress Level
Stress level is the result of a three-minute test performed while
standing still, where the Forerunner device analyzes heart rate
variability to determine your overall stress. Training, sleep,
nutrition, and general life stress all impact how a runner
performs. The stress level range is from 1 to 100, where 1 is a
very low stress state and 100 is a very high stress state.
Knowing your stress level can help you decide if your body is
ready for a tough training run or yoga.
Using the Stress Level Widget
The stress level widget displays your current stress level and a
graph of your stress level for the last several hours. It can also
guide you through a breathing activity to help you relax.
1
While you are sitting or inactive, select UP or DOWN to view
the stress level widget.
16
2
Select START.
• If your stress level is in the low or medium range, a graph
appears showing your stress level for the last four hours.
TIP: To start a relaxation activity from the graph, select
DOWN > START, and enter a duration in minutes.
• If your stress level is in the high range, a message
appears asking you to begin a relaxation activity.
3
Select an option:
• View your stress level graph.
NOTE: Blue bars indicate periods of rest. Yellow bars
indicate periods of stress. Gray bars indicate times when
you were too active to determine your stress level.
• Select Yes to start the relaxation activity, and enter a
duration in minutes.
• Select No to bypass the relaxation activity and view the
stress level graph.
Body Battery
Your device analyzes your heart rate variability, stress level,
sleep quality, and activity data to determine your overall Body
Battery level. Like a gas gauge on a car, it indicates your
amount of available reserve energy. The Body Battery level
range is from 0 to 100, where 0 to 25 is low reserve energy, 26
to 50 is medium reserve energy, 51 to 75 is high reserve energy,
and 76 to 100 is very high reserve energy.
You can sync your device with your Garmin Connect account to
view your most up-to-date Body Battery level, long-term trends,
and additional details
(Tips for Improved Body Battery Data,
page
17).
Viewing the Body Battery Widget
The Body Battery widget displays your current Body Battery
level and a graph of your Body Battery level for the last several
hours.
1
Select UP or DOWN to view the Body Battery widget.
NOTE: You may need to add the widget to your widget loop
(Customizing the Widget Loop, page
2
Select START to view a combined graph of your Body
Battery and stress level.
Blue bars indicate periods of rest. Orange bars indicate
periods of stress. Gray bars indicate times that you were too
active to determine your stress level.
3
Select DOWN to see your Body Battery data since midnight.
22).
Heart Rate Features
