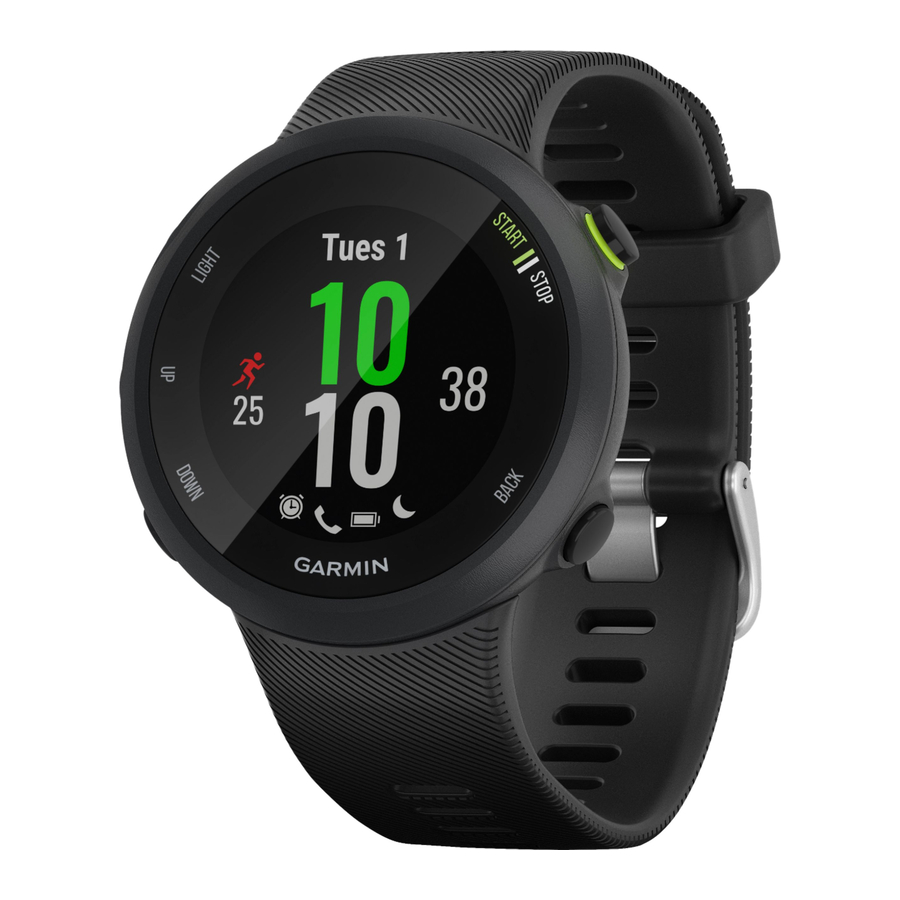
Garmin FORERUNNER 45 Kullanıcı El Kitabı - Sayfa 13
İzle Garmin FORERUNNER 45 için çevrimiçi göz atın veya pdf Kullanıcı El Kitabı indirin. Garmin FORERUNNER 45 24 sayfaları.
Ayrıca Garmin FORERUNNER 45 için: Kullanıcı El Kitabı (12 sayfalar)

About VO2 Max. Estimates
VO2 max. is the maximum volume of oxygen (in milliliters) you
can consume per minute per kilogram of body weight at your
maximum performance. In simple terms, VO2 max. is an
indication of athletic performance and should increase as your
level of fitness improves. The Forerunner device requires wrist-
based heart rate or a compatible chest heart rate monitor to
display your VO2 max. estimate.
On the device, your VO2 max. estimate appears as a number,
description, and position on the color gauge. On your Garmin
Connect account, you can view additional details about your
VO2 max. estimate, including your fitness age. Your fitness age
gives you an idea of how your fitness compares with a person of
the same gender and different age. As you exercise, your fitness
age can decrease over time.
Purple
Blue
Green
Yellow
Red
VO2 max. data is provided by FirstBeat. VO2 max. analysis is
provided with permission from The Cooper Institute
information, see the appendix
page
17), and go to www.CooperInstitute.org.
Heart Rate Variability and Stress Level
Stress level is the result of a three-minute test performed while
standing still, where the Forerunner device analyzes heart rate
variability to determine your overall stress. Training, sleep,
nutrition, and general life stress all impact how a runner
performs. The stress level range is from 1 to 100, where 1 is a
very low stress state and 100 is a very high stress state.
Knowing your stress level can help you decide if your body is
ready for a tough training run or yoga.
Using the Stress Level Widget
The stress level widget displays your current stress level and a
graph of your stress level for the last several hours. It can also
guide you through a breathing activity to help you relax.
1
While you are sitting or inactive, select UP or DOWN to view
the stress level widget.
2
Select START.
• If your stress level is in the low or medium range, a graph
appears showing your stress level for the last four hours.
TIP: To start a relaxation activity from the graph, select
DOWN > START, and enter a duration in minutes.
• If your stress level is in the high range, a message
appears asking you to begin a relaxation activity.
3
Select an option:
• View your stress level graph.
NOTE: Blue bars indicate periods of rest. Yellow bars
indicate periods of stress. Gray bars indicate times when
you were too active to determine your stress level.
• Select Yes to start the relaxation activity, and enter a
duration in minutes.
Heart Rate Features
Superior
Excellent
Good
Fair
Poor
. For more
®
(VO2 Max. Standard Ratings,
• Select No to bypass the relaxation activity and view the
stress level graph.
Body Battery
Your device analyzes your heart rate variability, stress level,
sleep quality, and activity data to determine your overall Body
Battery level. Like a gas gauge on a car, it indicates your
amount of available reserve energy. The Body Battery level
range is from 0 to 100, where 0 to 25 is low reserve energy, 26
to 50 is medium reserve energy, 51 to 75 is high reserve energy,
and 76 to 100 is very high reserve energy.
You can sync your device with your Garmin Connect account to
view your most up-to-date Body Battery level, long-term trends,
and additional details
(Tips for Improved Body Battery Data,
page
9).
Viewing the Body Battery Widget
The Body Battery widget displays your current Body Battery
level and a graph of your Body Battery level for the last several
hours.
1
Select UP or DOWN to view the Body Battery widget.
NOTE: You may need to add the widget to your widget loop
(Customizing the Widget Loop, page
2
Select START to view a combined graph of your Body
Battery and stress level.
Blue bars indicate periods of rest. Orange bars indicate
periods of stress. Gray bars indicate times that you were too
active to determine your stress level.
3
Select DOWN to see your Body Battery data since midnight.
Tips for Improved Body Battery Data
• Your Body Battery level updates when you sync your device
with your Garmin Connect account.
• For more accurate results, wear the device while sleeping.
• Rest and good sleep charge your Body Battery.
• Strenuous activity, high stress, and poor sleep can cause
your Body Battery to drain.
• Food intake, as well as stimulants like caffeine, has no
impact on your Body Battery.
12).
9
