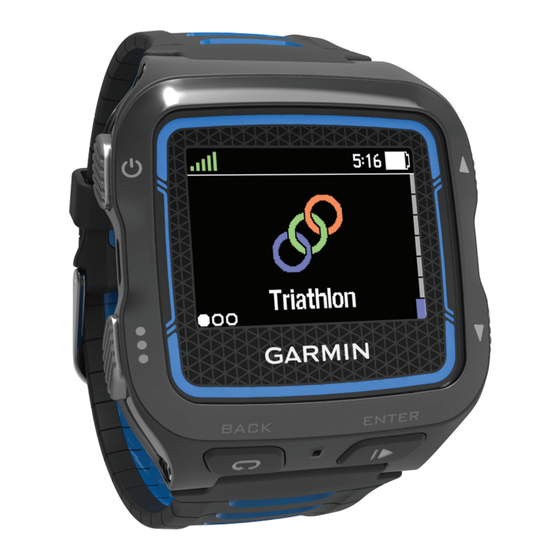
Garmin Forerunner 920XT Kullanıcı El Kitabı - Sayfa 14
İzle Garmin Forerunner 920XT için çevrimiçi göz atın veya pdf Kullanıcı El Kitabı indirin. Garmin Forerunner 920XT 28 sayfaları.
Ayrıca Garmin Forerunner 920XT için: Kullanıcı El Kitabı (24 sayfalar)

The Garmin logos should be right-side up.
4
Bring the device within 3 m (10 ft.) of the heart rate monitor.
After you put on the heart rate monitor, it is active and sending
data.
TIP: If the heart rate data is erratic or does not appear, see the
troubleshooting tips
(Tips for Erratic Heart Rate Data,
page
18).
Caring for the HRM-Run Accessory
You must unsnap and remove the module before washing the
strap.
A build up of sweat and salt on the strap can decrease the ability
of the heart rate monitor to report accurate data.
• Go to
www.garmin.com/HRMcare
instructions.
• Rinse the strap after every use.
• Machine wash the strap after every seven uses.
• Do not put the strap in a dryer.
• When drying the strap, hang it up or lay it flat.
• To prolong the life of your heart rate monitor, unsnap the
module when not in use.
Running Dynamics
You can use your compatible Forerunner device paired with the
HRM-Run accessory or HRM-Tri accessory to provide real-time
feedback about your running form. If your Forerunner device
was packaged with the heart rate monitor, the devices are
already paired.
The heart rate monitor has an accelerometer in the module that
measures torso movement in order to calculate six running
metrics.
NOTE: The HRM-Run accessory and the HRM-Tri accessory
are compatible with several ANT+ fitness products and can
display heart rate data when paired. The running dynamics
features are available on only some Garmin devices.
Cadence: Cadence is the number of steps per minute. It
displays the total steps (right and left combined).
Color Gauges and Running Dynamics Data
The running dynamics screen displays a color gauge for the primary metric. You can display cadence, vertical oscillation, or ground
contact time as the primary metric. The color gauge shows you how your running dynamics data compares to those of other
runners. The color zones are based on percentiles.
Garmin has researched many runners of all different levels. The data values in the red or orange zones are typical for less
experienced or slower runners. The data values in the green, blue, or purple zones are typical for more experienced or faster
runners. Less experienced runners tend to exhibit longer ground contact times, higher vertical oscillation, and lower cadence than
more experienced runners. However, taller runners typically have slightly slower cadences and slightly higher vertical oscillation. Go
to
www.garmin.com
for more information on running dynamics. For additional theories and interpretations of running dynamics data,
you can search reputable running publications and websites.
Color Zone
Percentile in Zone
Purple
>95
Blue
70–95
Green
30–69
Orange
5–29
Red
<5
Tips for Missing Running Dynamics Data
If running dynamics data does not appear, you can try these
tips.
• Make sure you are using the HRM-Run accessory or
HRM-Tri accessory.
The heart rate monitor has
• Pair the heart rate monitor with your Forerunner again,
according to the instructions.
10
NOTICE
for detailed washing
Cadence Range
>185 spm
174–185 spm
163–173 spm
151–162 spm
<151 spm
on the front of the module.
Vertical oscillation: Vertical oscillation is your bounce while
running. It displays the vertical motion of your torso,
measured in centimeters for each step.
Ground contact time: Ground contact time is the amount of
time in each step that you spend on the ground while
running. It is measured in milliseconds.
NOTE: Ground contact time is not available while walking.
Training with Running Dynamics
Before you can view running dynamics, you must put on the
HRM-Run accessory or HRM-Tri accessory and pair it with your
device
(Pairing Your ANT+ Sensors, page
If your Forerunner was packaged with the heart rate monitor, the
devices are already paired, and the Forerunner is set to display
running dynamics.
1
Select an option:
• If your Forerunner was packaged with the heart rate
monitor, put on your heart rate monitor, and go to step 2.
• If your heart rate monitor was purchased separately,
select
> Activity Settings > Data Screens > Running
Dynamics > Status > Enable.
2
Select Primary Metric.
3
Select Cadence, Ground Contact Time, or Vertical
Oscillation.
The primary metric appears as the top field on the data
screen with a corresponding position on the color gauge.
4
Go for a run.
5
Scroll to the running dynamics screen to view your metrics.
6
If necessary, hold
run.
Vertical Oscillation Range
<6.7 cm
6.7–8.3 cm
8.4–10.0 cm
10.1–11.8 cm
>11.8 cm
• If the running dynamics data display zeros, make sure the
module is worn right-side up.
NOTE: Ground contact time appears only while running. It
cannot be calculated while walking.
Setting Your Heart Rate Zones
The device uses your user profile information from the initial
setup to determine your default heart rate zones. The device
has separate heart rate zones for running, cycling, and
swimming. For the most accurate calorie data during your
8).
to change the primary metric during your
Ground Contact Time Range
<208 ms
208–240 ms
241–272 ms
273–305 ms
>305 ms
ANT+ Sensors
