Casio CFX-9850G PLUS Посібник з експлуатації - Сторінка 8

Переглянути онлайн або завантажити pdf Посібник з експлуатації для Калькулятор Casio CFX-9850G PLUS. Casio CFX-9850G PLUS 14 сторінок. 6. matrix calculations
Також для Casio CFX-9850G PLUS: Посібник користувача (18 сторінок), Посібник з комунікацій (13 сторінок), Посібник користувача програми (18 сторінок), Прочитайте цей перший посібник (13 сторінок), Посібник з графіки (8 сторінок), Посібник з графіки (6 сторінок), Посібник з графіки (12 сторінок), Посібник з графіки (12 сторінок), Посібник з графіки (12 сторінок), Посібник з графіки (12 сторінок), Посібник з графіки (10 сторінок), Посібник з розрахунків (13 сторінок), Посібник з розрахунків (18 сторінок), Посібник з розрахунків (15 сторінок), Посібник з комплексних чисел (6 сторінок), Посібник з розрахунків (6 сторінок), Посібник з розрахунків (20 сторінок)
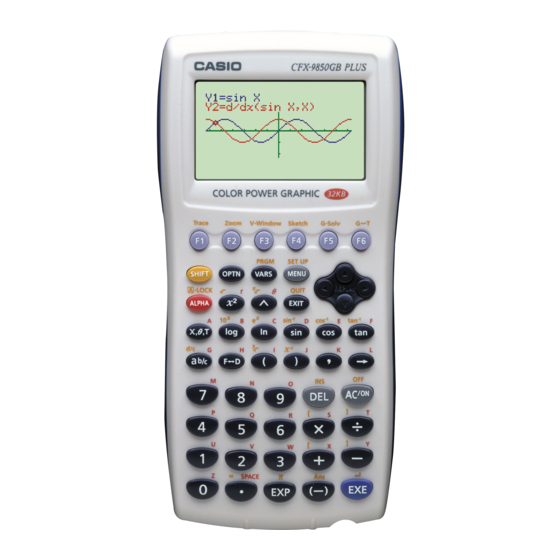
Casio CFX-9850G PLUS Посібник з експлуатації
10 - 2
Graphing with the Sketch Function
u u u u u To turn plot points on and off in the RUN or PRGM Mode
The following are the syntax for turning plot points on and off in these modes.
• To turn a plot point on
• To turn a plot point off
• To change the on/off status of a plot point
k k k k k Drawing a Line
To draw a line on a graph, first display the sketch menu and then press 6 (g)
2 (LINE) to display the line menu.
u u u u u To connect two plotted points with a line in the STAT, GRAPH,
1. After drawing a graph, display the sketch menu and then press 6 (g) 1
2. Use the cursor keys to move the pointer to the local maximum and press w to
3. Use the cursor keys to move the pointer to the local minimum.
160
x
PlotOn <
-coordinate>, <
x
PlotOff <
-coordinate>, <
x
PlotChg <
-coordinate>, <
• {Line} ... {Draw a line between two plotted points}
• {F·Line} ... {Draw a line}
TABLE, RECUR and CONICS Modes
Example
To draw a line between the local maximun and local minimum
on the graph of
Use the same View Window parameters as in the example on page
155.
(PLOT) 1 (Plot) to display the pointer in the center of the screen.
plot it.
y
-coordinate>
y
-coordinate>
y
-coordinate>
y
x
x
x
=
(
+ 2)(
– 2)
[Sketch]-[LINE]
[Sketch]-[LINE]-[Line]