Casio CFX-9850G PLUS Посібник з графіки - Сторінка 8

Переглянути онлайн або завантажити pdf Посібник з графіки для Калькулятор Casio CFX-9850G PLUS. Casio CFX-9850G PLUS 8 сторінок. 6. matrix calculations
Також для Casio CFX-9850G PLUS: Посібник користувача (18 сторінок), Посібник з комунікацій (13 сторінок), Посібник користувача програми (18 сторінок), Прочитайте цей перший посібник (13 сторінок), Посібник з експлуатації (14 сторінок), Посібник з графіки (6 сторінок), Посібник з графіки (12 сторінок), Посібник з графіки (12 сторінок), Посібник з графіки (12 сторінок), Посібник з графіки (12 сторінок), Посібник з графіки (10 сторінок), Посібник з розрахунків (13 сторінок), Посібник з розрахунків (18 сторінок), Посібник з розрахунків (15 сторінок), Посібник з комплексних чисел (6 сторінок), Посібник з розрахунків (6 сторінок), Посібник з розрахунків (20 сторінок)
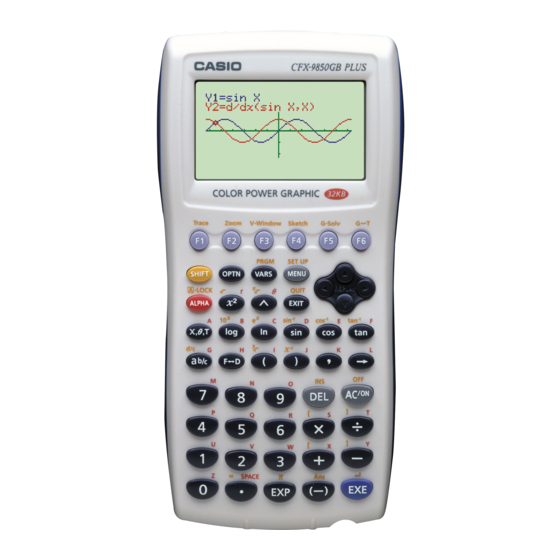
Casio CFX-9850G PLUS Посібник з графіки
11 - 4
Displaying a Graph in the Inactive Screen
k k k k k Other Graph Functions with Dual Graph
After drawing a graph using Dual Graph, you can use the trace, zoom, sketch and
scroll functions. Note, however, that these functions are available only for the
P.128
active (left) graph. For details on using these functions, see "8-6 Other Graphing
Functions".
The following shows some example operations using the zoom function.
Example 1
Assume that the function is already stored in memory area Y1.
Press 6 (DRAW) or w to draw the graph.
174
• To perform any of the above operations on the inactive graph, first move the
inactive graph to the active screen.
• The graph screen will not scroll while a trace operation is being performed on
the active graph.
To use box zoom to enlarge the graph of
Use the following View Window parameters for the active graph.
Xmin
= –2
Xmax =
Xscale = 0.5
!2(Zoom)1(BOX)
• Use the cursor keys to move the pointer to
one of the corners of the box and then press
w.
• Use the cursor keys to move to the opposite corner of the box and then press
w to enlarge the graph.
• The zoom operation changes the View Window parameters of the inactive
screen, so the graph in the inactive screen is cleared.
Ymin
= –2
2
Ymax =
Yscale =
y
x
x
=
(
+ 1) (
2
1
x
– 1)