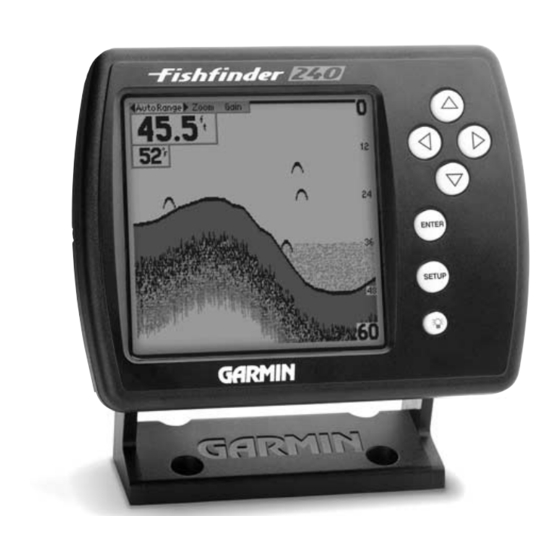
On the Water
On the Water
Unit Operation and the Chart
1
2
1
3
This fi sh is currently in a Dead Zone and is not detected
by the sonar. The fi sh is in the coverage area of the
transducer, but remember the fi rst strong return sets the
bottom level. The fi sh will never be detected since the
bottom level will never be set below the fi sh. The fi sh
on the right side of the display (shown in light grey) will
be detected and displayed when the transducer cone
passes over the fi sh.
28
28
Understanding Sonar
this section may not be for you. This section is intended to help the novice
user gain some understanding of how the Fishfinder 160 operates and how
it can help improve their fishing productivity.
general knowledge of how the unit works and how it determines what to
display. Briefly described, the unit operates by transmitting sound waves
toward the bottom of a lake, stream or seabed in a cone shaped pattern.
When a transmitted soundwave strikes an underwater object such as the
bottom, a piece of structure, or a fish, sound is reflected back to the
3
2
transducer. The transducer collects the reflected sound waves and sends
the data to the unit to be processed and displayed on the chart. The
underwater data is displayed on the chart in the order that it is returned:
first returned—first on the chart. The diagram in the sidebar demonstrates
this showing an underwater scene as it would be displayed on the chart.
Generally speaking, if the only thing between the transducer and the
bottom is water, the first strong return will come from the bottom directly
below the transducer. The first strong return sets the bottom level. Weaker
secondary returns provide the detailed data. Stronger returns will display
in darker colors, black being the strongest return. In Example 2 (page 30)
you can see that the branches and the fish were the strongest secondary
returns and are indicated in black on the display.
look at how this data can help you to improve your fishing.
If you are familiar with sonar, and can determine what is on the chart,
To understand what the unit is displaying, it is important to have a
That is brief description of how your Fishfinder operates. Let' s take a