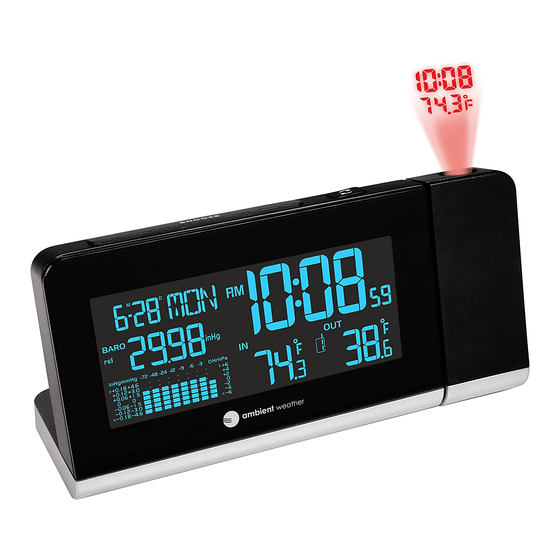
Ambient Weather WS-8460 Manual del usuario - Página 10
Navegue en línea o descargue pdf Manual del usuario para Reloj despertador Ambient Weather WS-8460. Ambient Weather WS-8460 17 páginas. Clear view projection alarm clock with indoor temperature and color changing outdoor temperature

3. Press the UP to increase the relative pressure and DOWN to decrease the relative pressure.
4. Press (do not hold) the BARO button again to exit the relative pressure calibration mode, or
wait 60 seconds to time out.
Note: After calibration, the barograph will reset to 0 change (flat line across the graph).
5.4.3.1 Relative vs. Absolute Pressure and Calibration
The clock displays two different pressures: absolute (measured) and relative (corrected to sea-level).
To compare pressure conditions from one location to another, meteorologists correct pressure to
sea-level conditions. Because the air pressure decreases as you rise in altitude, the sea-level corrected
relative pressure (the pressure your location would be at if located at sea-level) is generally higher
than your measured absolute pressure.
Thus, your absolute pressure may read 28.62 inHg (969 mb) at an altitude of 1000 feet (305 m), but
the relative pressure is 30.00 inHg (1016 mb).
The standard sea-level pressure is 29.92 in Hg (1013 mb). This is the average sea-level pressure
around the world.
Relative pressure measurements greater than 29.92 inHg (1013 mb) are
considered high pressure and relative pressure measurements less than 29.92 inHg are considered low
pressure.
To determine the relative pressure for your location, locate an official reporting station near you (the
internet is the best source for real time barometer conditions, such as Weather.com or
Wunderground.com), and set your weather station to match the official reporting station.
5.5 The Barograph
The barograph allows you to predict weather by displaying the change in pressure over time.
In general, when pressure is increasing, the weather is improving, and when pressure is decreasing, the
weather is deteriorating. This is referred to by meteorologists as high pressure and low pressure
conditions. Storms and hurricanes will result in a rapid decrease in pressure. Hot, dry weather is
usually a result of high pressure.
The graph displays the pressure trend over the last 24 hours (the oldest data is on the left of the graph
and the newest data is on the right of the graph. The horizontal axis is time, and is plotted -1, -2, -3, -6,
-12, -18 and -24 hours ago.
The vertical axis is the change in pressure from the current pressure. Thus, the current pressure is
displayed as 0. The vertical axis is auto-scaled, and will change automatically based on the magnitude
of the change in pressure over the 24 hour period.
The example in Figure 7 shows a drop in pressure 6 hours ago of about -4 hPa.
Version 1.0
©Copyright 2016, Ambient LLC. All Rights Reserved.
Page 10
