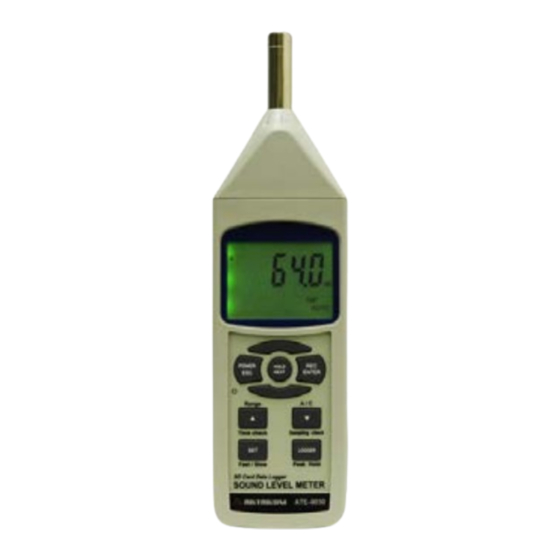
Aktakom ATE-9030 Manuel de l'utilisateur - Page 5
Parcourez en ligne ou téléchargez le pdf Manuel de l'utilisateur pour {nom_de_la_catégorie} Aktakom ATE-9030. Aktakom ATE-9030 9 pages. Sound level meter

During execute the Datalogger function, if press the «Logger Button» (3-8, Fig. 1) once will pause the Datalogger
function (stop to save the measuring data into the memory circuit temporally). In the same time the text of «REC» will
stop flashing.
Remark: If press the «Logger Button» (3-8, Fig. 1) once again will execute the Datalogger again, the text of «REC»
will flashing.
c. Finish the Datalogger
During pause the Datalogger, press the «REC Button» (3-4, Fig. 1) continuously at least two seconds, the «REC»
indicator will be disappeared and finish the Datalogger.
Remark: When the battery is under the low battery condition (show the low battery indicator), the Datalogger
function is disable.
5-3 Manual Datalogger (Set sampling time = 0 second)
a. Set sampling time is to 0 second
Press the «REC Button» (3-4, Fig. 1) once, the LCD will show the text «REC», then press the «Logger Button»
(3-8, Fig. 1) once, the «REC» will flashing once, at the same time the measuring data along the time information and
the Position no. will be saved into the memory circuit.
Remark:
* Lower Display will show the Position/Location no. (P1, P2... P99).
* During execute the Manual Datalogger, press the «SET Button» (3-7, Fig. 1 ) once, then use the «▲ Button» (3-
5, Fig. 1) or «▼ Button» (3-6, Fig. 1) to set the measuring position (1 to 99, for example room 1 to room 99) to identify
the measurement location. After finish the adjustment location no., press the «Enter Button» to entry.
b. Finish the Datalogger
Press the «REC Button» (3-4, Fig. 1) continuously at least two seconds, the «REC» indication will be disappeared
and finish the Datalogger.
5-4 Check time information
During the measurement if press «Time check Button» (3-5, Fig. 1) > 2 seconds, the lower LCD display will present
the time information of Year/Month, Date/Hour, Minute/Second.
5-5 Check sampling time information
During the measurement, If press «Sampling Check Button» (3-6, Fig. 1) once , the lower LCD display will present
the Sampling time information in second unit.
5-6 SD Card Data structure
1) When the SD card is used into the meter, the SD card When the first time, the SD card is used into the meter,
the SD card will generate a folder :
SLA01
2) If the first time to execute the Datalogger, under the route SLA01\, will generate a new file name SLA01001.XLS.
After exist the Datalogger, then execute again, the data will save to the SLA01001.XLS until Data column reach to
30,000 columns, then will generate a new file, for example SLA01002.XLS
3) Under the folder SLA01\, if the total files more than 99 files, will generate anew route, such as SLA02\ ........
4) The file's route structure:
SLA01\
SLA01001.XLS
SLA01002.XLS
.....................
SLA01099.XLS
SLA02\
SLA02001.XLS
SLA02002.XLS
.....................
SLA02099.XLS
SLAXX\
.....................
.....................
Remark: XX : Max. value is 10.
6. SAVING DATA FROM THE SD CARD TO THE COMPUTER (EXCEL
SOFTWARE)
1) After execute the Data Logger function, take away the SD card out from the «SD card socket» (3-18, Fig. 1).
2) Plug in the SD card into the Computer's SD card slot (if your computer build in this installation) or insert the SD
card into the «SD card adapte». Then connect the «SD card adapter» into the computer.
3) Power ON the computer and run the «EXCEL software». Down load the saving data file (for example the file
name: SLA01001.XLS, SLA01002.XLS) from the SD card to the computer. The saving data will present into the
EXCEL software screen (for example as following EXCEL data screens), then user can use those EXCEL data to make
the further Data or Graphic analysis usefully.
EXCEL data screen (for example)
www.tmatlantic.com
5
