Casio CFX-9950GB PLUS 기능 설명서 - 페이지 6

{카테고리_이름} Casio CFX-9950GB PLUS에 대한 기능 설명서을 온라인으로 검색하거나 PDF를 다운로드하세요. Casio CFX-9950GB PLUS 14 페이지. 6. matrix calculations
Casio CFX-9950GB PLUS에 대해서도 마찬가지입니다: 소프트웨어 설명서 (20 페이지), 사용자 설명서 (18 페이지), 커뮤니케이션 매뉴얼 (13 페이지), 프로그램 매뉴얼 (18 페이지), 첫 번째 매뉴얼 읽기 (13 페이지), 그래프 매뉴얼 (8 페이지), 그래프 매뉴얼 (6 페이지), 그래프 매뉴얼 (12 페이지), 그래프 매뉴얼 (12 페이지), 그래프 매뉴얼 (12 페이지), 그래프 매뉴얼 (12 페이지), 그래프 매뉴얼 (10 페이지), 계산 매뉴얼 (13 페이지), 계산 매뉴얼 (18 페이지), 계산 매뉴얼 (15 페이지), 복소수 매뉴얼 (6 페이지), 계산 매뉴얼 (6 페이지), 계산 매뉴얼 (20 페이지)
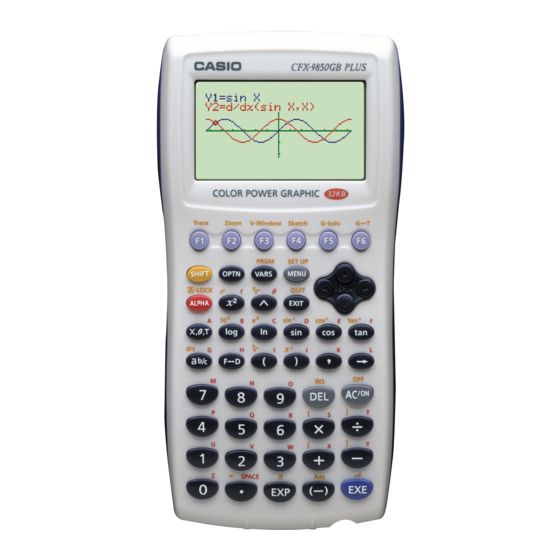
Casio CFX-9950GB PLUS 기능 설명서
10 - 2
Graphing with the Sketch Function
k k k k k Plotting Points
When plotting points on a graph, first display the sketch menu and then press 6
(g) 1 (PLOT) to display the plot menu.
u u u u u To plot points in the STAT, GRAPH, TABLE, RECUR and CONICS
1. After drawing the graph, display the sketch menu and press 6 (g) 1 (PLOT)
2. Use the cursor keys to move the pointer the locations of the points you want to
u u u u u To plot points in the RUN or PRGM Mode
The following is the syntax for plotting points in these modes.
158
• {Plot} ... {plot a point}
• {Pl·On} ... {plot point at specific coordinates}
• {Pl·Off} ... {delete point at specific coordinates}
• {Pl·Chg} ... {switch status of point at specific coordinates}
Modes
Example
To plot a point on the graph of
1 (Plot) to display the pointer in the center of the screen.
plot and press w to plot.
• You can plot as many points as you want.
x
• The current
- and
X and Y.
x
Plot <
-coordinate>, <
Example
To plot a point at (2, 2)
Use the following View Window parameters.
Xmin
Xmax = 5
Xscale = 1
y
-coordinate values are assigned respectively to variables
y
-coordinate>
= –5
Ymin
Ymax = 10
Yscale =
[Sketch]-[PLOT]
[Sketch]-[PLOT]-[Plot]
y
x
x
x
=
(
+ 2)(
– 2)
[Sketch]-[PLOT]-[Plot]
= –10
2