Casio CFX-9950GB PLUS İşlev Kılavuzu - Sayfa 6

Hesap Makinesi Casio CFX-9950GB PLUS için çevrimiçi göz atın veya pdf İşlev Kılavuzu indirin. Casio CFX-9950GB PLUS 14 sayfaları. 6. matrix calculations
Ayrıca Casio CFX-9950GB PLUS için: Yazılım Kılavuzu (20 sayfalar), Kullanıcı Kılavuzu (18 sayfalar), İletişim Kılavuzu (13 sayfalar), Program Kılavuzu (18 sayfalar), Önce Bu Kılavuzu Okuyun (13 sayfalar), Grafik Kılavuzu (8 sayfalar), Grafik Kılavuzu (6 sayfalar), Grafik Kılavuzu (12 sayfalar), Grafik Kılavuzu (12 sayfalar), Grafik Kılavuzu (12 sayfalar), Grafik Kılavuzu (12 sayfalar), Grafik Kılavuzu (10 sayfalar), Hesaplamalar Kılavuzu (13 sayfalar), Hesaplamalar Kılavuzu (18 sayfalar), Hesaplamalar Kılavuzu (15 sayfalar), Karmaşık Sayılar Kılavuzu (6 sayfalar), Hesaplamalar Kılavuzu (6 sayfalar), Hesaplamalar Kılavuzu (20 sayfalar)
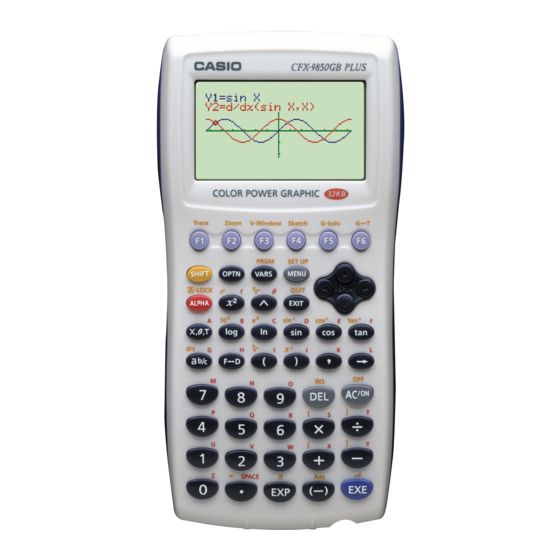
Casio CFX-9950GB PLUS İşlev Kılavuzu
10 - 2
Graphing with the Sketch Function
k k k k k Plotting Points
When plotting points on a graph, first display the sketch menu and then press 6
(g) 1 (PLOT) to display the plot menu.
u u u u u To plot points in the STAT, GRAPH, TABLE, RECUR and CONICS
1. After drawing the graph, display the sketch menu and press 6 (g) 1 (PLOT)
2. Use the cursor keys to move the pointer the locations of the points you want to
u u u u u To plot points in the RUN or PRGM Mode
The following is the syntax for plotting points in these modes.
158
• {Plot} ... {plot a point}
• {Pl·On} ... {plot point at specific coordinates}
• {Pl·Off} ... {delete point at specific coordinates}
• {Pl·Chg} ... {switch status of point at specific coordinates}
Modes
Example
To plot a point on the graph of
1 (Plot) to display the pointer in the center of the screen.
plot and press w to plot.
• You can plot as many points as you want.
x
• The current
- and
X and Y.
x
Plot <
-coordinate>, <
Example
To plot a point at (2, 2)
Use the following View Window parameters.
Xmin
Xmax = 5
Xscale = 1
y
-coordinate values are assigned respectively to variables
y
-coordinate>
= –5
Ymin
Ymax = 10
Yscale =
[Sketch]-[PLOT]
[Sketch]-[PLOT]-[Plot]
y
x
x
x
=
(
+ 2)(
– 2)
[Sketch]-[PLOT]-[Plot]
= –10
2