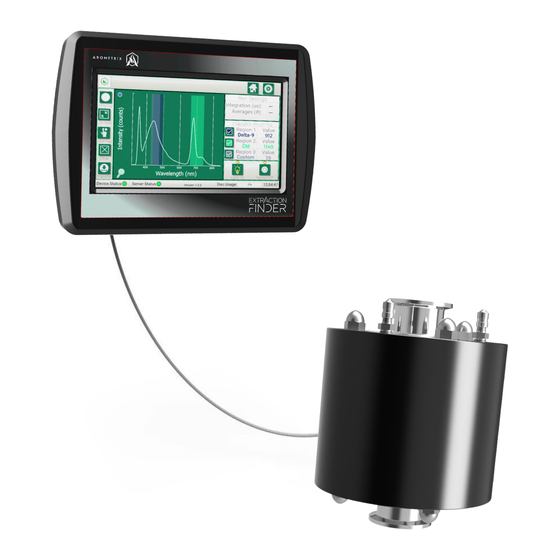
Arometrix Extraction Finder 사용자 설명서 - 페이지 10
{카테고리_이름} Arometrix Extraction Finder에 대한 사용자 설명서을 온라인으로 검색하거나 PDF를 다운로드하세요. Arometrix Extraction Finder 14 페이지.
Arometrix Extraction Finder에 대해서도 마찬가지입니다: 빠른 시작 매뉴얼 (2 페이지), 사용자 설명서 (20 페이지)

List of buttons:
A. Display: Toggles between the two viewing options (Spectrum View & Wavelength View)
B. Details: Expands the graph and removes the data on the right-hand side
C. Overlay: Traces or "overlays" a peak of interest so you can compare it to a future peak
D. Clear: Clears an "overlay" that you no longer want to track
E. Transfer: Transfers recorded run data to a flash drive
F. Reference Peak Remover: Removes the internal reference/excitation peak from Spectrum view
G. Auto-Zoom: Returns zoom view to normal. You can zoom with 1 finger by drawing a bounding box.
H. Home: Returns you to the Home if you are in Settings
I.
Settings: Allows you to adjust settings, such as Auto Integration Time, Scans to Average, and the
Wavelength Tracker
J.
Region 1-3 Checkboxes: For Wavelength View - By checking this box, it will populate the
Wavelength plot with the corresponding molecule tracking. For Spectrum View - By checking this
box, it will highlight the Spectrum plot with the region that molecule fluoresces at. For Wavelength
View - By checking this box, a color-coordinated line will track the molecules' intensity levels.
K. Region 2 Checkbox: See I.
L. Region 3 Checkbox: See I.
M. Light on/off: Turns the light on. This toggles between states.
N. Record on/off: Turns the recording mode on. This toggles between states.
Settings Tutorial
When you tap the Settings button, you will see:
● Wavelength Settings
● Set Integration Time
● Set Scans to Average
● Clock Settings
● System Data
Wavelength Settings
In this tab, you will see:
● Edit Wavelength 1
● Edit Wavelength 2
● Edit Wavelength 3
Arometrix, Inc.
Setup Screen Tutorial
arometrix.com/resources
10
