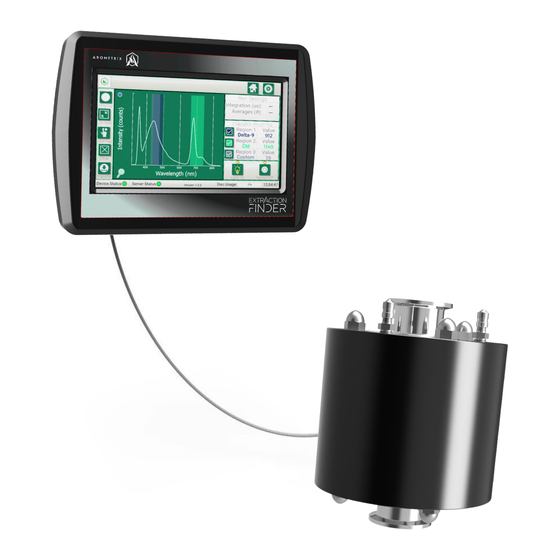
Arometrix Extraction Finder 사용자 설명서 - 페이지 9
{카테고리_이름} Arometrix Extraction Finder에 대한 사용자 설명서을 온라인으로 검색하거나 PDF를 다운로드하세요. Arometrix Extraction Finder 14 페이지.
Arometrix Extraction Finder에 대해서도 마찬가지입니다: 빠른 시작 매뉴얼 (2 페이지), 사용자 설명서 (20 페이지)

Important Note:
The peak at 360-390nm is an internal excitation/reference peak (not a process indicator);
tap the small circle on the top-left corner of the graph if you wish to remove this peak.
Understanding the Graph (X-Y Axis)
●
X-axis = Wavelength (nm):
molecule(s) passing through; different molecules have different wavelength regions
●
Y-axis = Intensity
is present at that moment relative to earlier.
What it does:
Displays and tracks the interpreted values from your measurement. This plot reduces the
raw data and shows you the "highlights" of the run. This view is especially useful for seeing how molecular
levels changed over time. Arometrix recommends that Extraction Finder users prioritize this view.
Understanding the Graph (X-Y Axis)
●
X-axis = Time (HH:MM:SS):
pre-set ranges as a function of time.
●
Y-axis = Intensity
that moment relative to earlier. (Note: These are AU as in Arbitrary Units; this is not quantification
of potency.)
Arometrix, Inc.
The location of where the line shoots up (or fluoresces) indicates the
(counts): The height of this line, in general, indicates how much of that substance
Wavelength View - Time Tracking
As opposed to the Spectrum view, this tracks molecular levels for
(AU): The height of this line indicates how much of that substance is present at
arometrix.com/resources
9
