DFE SW6 Operating Instructions Manual - Page 9
Browse online or download pdf Operating Instructions Manual for Controller DFE SW6. DFE SW6 20 pages. Digital tension controller

1.2 DISPLAY MODE DESCRIPTIONS
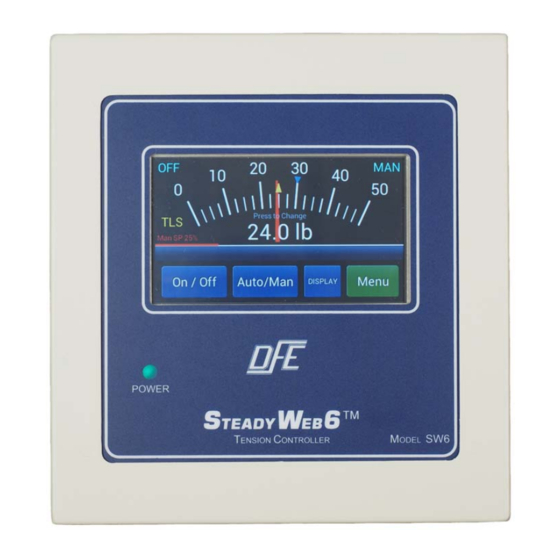
1. Analog Meter - The analog meter displays tension with a bold needle sweeping across similarly bold
divisions in the form of a traditional analog meter, and is the default display (Fig. 4). The meter scale is
determined by the full range tension value. This easily read analog meter is further enhanced by a large
digital tension readout in the center of the screen, and expresses the measured tension in white
characters. The auto tension setpoint is indicated by a yellow caret atop the smaller divisions of the
analog meter.
The controller output, when tension control is on, is indicated as a percentage of full output to the left of
the meter scale, above the On/Off button. When tension control is off, this indicated as the manual
setpoint instead.
Figure 4 - ANALOG METER DISPLAY
When Taper is active, a blue caret, also found atop the smaller divisions of the meter scale indicates the
dynamic tension setpoint.
When TLS Low and / or TLS High are active, those limits are indicated by blue and red carets
respectively, atop the larger divisions of the meter scale. For more details about TLS, see Section 2.6,
TLS ALARMS AND RESETTING THEM.
2. Trend-line Graph - An alternative to the analog meter, the tension trend-line graph (Fig. 5) plots both
the tension and the controller output versus time, from right to left. Since the plots of tension and
controller output can cross or overlap each other, the controller output is plotted as a line, and the area
below the tension plot is filled in, with both sets of data plotted in contrasting colors for improved clarity.
The plots of the tension and output are keyed to a legend in the left margin and the auto tension setpoint
is identified by a yellow caret in the right margin of the trend-line graph. If Taper is active, and auto
tension control is on, the dynamic tension setpoint is indicated by a "T" moving in the right hand margin
of the display.
The time it takes for the trend-line to cross the screen is the Line Graph Update Time, and is
selectable as 30 seconds or 1, 2, 5, 10 or 30 minutes, per Section 2.2, DISPLAY ADJUSTMENTS. The
greater durations allow for a greater data sample, but with a loss of resolution.
The trend-line may also be paused by holding down the Display button until the trend-line stops
moving across the screen. Plotting will resume when the Display button is pressed again. Tension data
for the paused period will not be recorded, and may not be retrieved.
When TLS is used, neither TLS Low nor TLS High Limits will be indicated on the Trend-line graph. If
either tension limit switch is tripped however, the on-screen alarms will still be issued, and must be
cleared according to Section 2.6, TLS ALARMS AND RESETTING THEM.
This trend-line graph display also appears repeatedly in the Technical Reference Manual (DFE P/N
801-2540) on PID Tune View displays which allow for real-time P, I, and D adjustments while viewing
the controller output and tension.
1.3 MENU MODE AND NAVIGATION
From either of the tension display screens, the Menu button will deliver the operator to the Main Menu (Fig.
6) where subordinate menus appear for further navigation. Note that the names of all menu screens are
consistently displayed at the center of the top line.
continued....
Figure 5 - TREND LINE GRAPH DISPLAY
3
